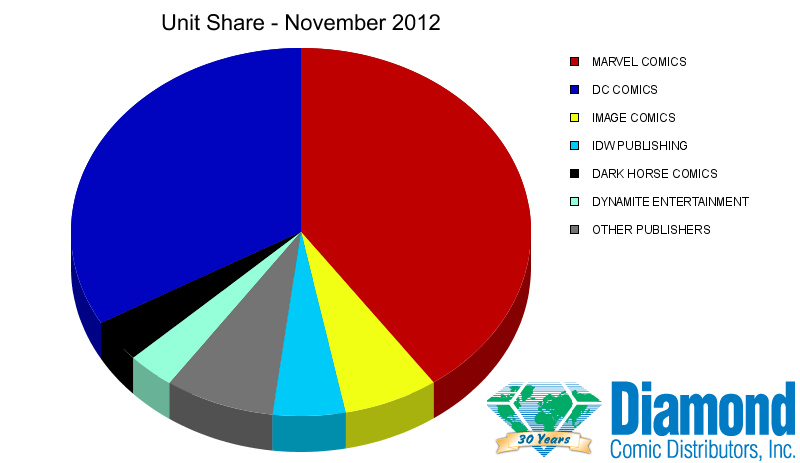
Diamond Comic Distributors has released the market share data for comics released in the direct market for November 2012. While the year has been positive, November saw an overall drop in comic sales.
On the plus side, Marvel NOW! lead the month with All New X-Men #1 leading the pack of comics. In fact, the top ten comics for the month heavily favors Marvel’s #1 initiative, just like DC did when it launched the New 52.
| RANK | DESCRIPTION | PRICE | PUBLISHER |
|---|---|---|---|
| 1 | ALL NEW X-MEN #1 | $3.99 | MAR |
| 2 | BATMAN #14 | $3.99 | DC |
| 3 | CAPTAIN AMERICA #1 | $3.99 | MAR |
| 4 | DEADPOOL #1 | $2.99 | MAR |
| 5 | INDESTRUCTIBLE HULK #1 | $3.99 | MAR |
| 6 | IRON MAN #1 | $3.99 | MAR |
| 7 | FANTASTIC FOUR #1 | $2.99 | MAR |
| 8 | UNCANNY AVENGERS #2 | $3.99 | MAR |
| 9 | JUSTICE LEAGUE #14 | $3.99 | DC |
| 10 | THOR: GOD OF THUNDER #1 | $3.99 | MAR |
Marvel Comics was November’s leading publisher in both Retail Dollars and Unit Market Share, leading DC Entertainment 34.35% to 30.04% in dollars and 40.23% to 33.25% in units.
| PUBLISHER | DOLLAR SHARE | UNIT SHARE |
|---|---|---|
| MARVEL COMICS | 34.35% | 40.23% |
| DC COMICS | 30.04% | 33.25% |
| IMAGE COMICS | 7.70% | 6.67% |
| IDW PUBLISHING | 5.60% | 5.07% |
| DARK HORSE COMICS | 4.72% | 3.75% |
| DYNAMITE ENTERTIANMENT | 3.71% | 3.33% |
| BOOM! STUDIOS | 1.90% | 1.81% |
| EAGLEMOSS PUBLICATIONS LTD | 1.40% | 0.33% |
| VIZ MEDIA | 1.33% | 0.45% |
| RANDOM HOUSE | 0.97% | 0.25% |
| OTHER NON-TOP 10 | 8.28% | 4.86% |
The good news is, comics sales continue to climb from past years as the November sales were higher in 2012 than they were in 2011 by 3.55%, with the year to date sales compared to 2011 are higher by nearly 15%. On the downside, compared to October 2012, sales are down by 3.8% in the total number of comics sold, and 8% lower on the the dollar amount. There was a slight dip (less than 1%) in October compared to September, and with the holiday season upon us, it is understandable that interest in comics slips while interest in Furby’s and Wii U is on the rise.


